## set a global seed
set.seed(08012025)Identification of breast cancer subtypes
Aims
The goal of this report is to identify breast cancer subtypes by using a graph-based approach. To this end, I built a K-nearest neighbor (KNN) graph, where each node is a patient connected to its nearest neighbors, in the high-dimensional space (i.e. I used the top 25 principal components and the top 3000 variable genes). Edges between patients are weighted based on the Jaccard similarity, the higher the weight the larger is their overlap in their local neighborhoods. I then applied the Louvain algorithm to identify patient communities, where patients in the same group are more strongly connected to each others compared to those in different groups (on the basis of gene expression profiles). Finally, I visualized the cluster distribution with t-SNE and UMAP and I labeled patients on the basis of status of 5 biomarkers (estrogen receptor (ER), progesterone receptor (PgR), human epidermal growth factor receptor 2 (HER2), Ki67, and Nottingham histologic grade (NHG)) to see if there are associations between patients communities and biomarker status.
Methods
Due to the presence of missing values (NA) in biomarker status (see Biomarkers Annotation), I explore these scenarios:
Clustering of all 3273 patients and annotation according to PAM50 subtypes (consensus histopathology labels) provided in the metadata
Clustering of patients with complete annotations for all 5 biomarkers (1373 patients)
Clustering of patients separately for each biomarker (excluding NA)
For each clustering scenario, I considered the top 3000 genes that exhibit the highest patient-to-patient variation in the dataset (i.e, those genes that are highly expressed in some patients, and lowly expressed in others).
Results
Overall, the analysis suggests that patients stratify according to the 5 biomarkers, in particular according to ER and PgR status.
Loading data
gexp <- read_csv(
  'data/gene_expression_profile.csv.gz',
  col_types = cols()
)

meta <- read_csv('data/metadata.csv', col_types = cols()) |>
  rename(sampleID = values, sampleName = ind) |>
  filter(sampleID %in% names(gexp)) |>
  mutate(
    er_status = factor(er_status, levels = c(0, 1), labels = c("ER-", "ER+")),
    pgr_status = factor(pgr_status, levels = c(0, 1), labels = c("PgR-", "PgR+")),
    her2_status = factor(her2_status, levels = c(0, 1), labels = c("HER2-", "HER2+")),
    ki67_status = factor(ki67_status, levels = c(0, 1), labels = c("Ki67-", "Ki67+")),
    overall_survival_event = factor(overall_survival_event, levels = c(0, 1), labels = c("no survival", "survival")),
    endocrine_treated = factor(endocrine_treated, levels = c(0, 1), labels = c("no treated", "treated")),
    chemo_treated = factor(chemo_treated, levels = c(0, 1), labels = c("no treated", "treated")),
    lymph_node_group = factor(lymph_node_group),
    lymph_node_status = factor(lymph_node_status),
    pam50_subtype = factor(pam50_subtype),
    nhg = factor(nhg)
  )
md <- meta |>
column_to_rownames(var = 'sampleID')
mx <- gexp |>
select(genes, rownames(md)) |>
column_to_rownames(var = 'genes')Biomarkers Annotation
Percentage of patients with a given annotation is reported for each biomarker.
meta_long <- meta |>
  select(er_status, pgr_status, her2_status, ki67_status, nhg) |>
  pivot_longer(cols = everything(), names_to = "biomarker", values_to = "status")

df_counts <- meta_long |>
  group_by(biomarker, status) |>
  summarise(n = n(), .groups = "drop") |>
  group_by(biomarker) |>
  mutate(perc = n / sum(n))

ggplot(df_counts, aes(x = biomarker, y = perc, fill = status)) +
  geom_bar(stat = "identity") +
  geom_text(
    aes(label = scales::percent(perc, accuracy = 1)),
    position = position_stack(vjust = 0.5)
  ) +
  labs(x = "", y = "") +
  scale_y_continuous(labels = percent_format(accuracy = 1)) +
  guides(fill = guide_legend(title = NULL)) +
  theme_minimal() +
  theme(
    axis.text.y = element_blank(),
    axis.ticks.y = element_blank()
  )
Functions
Functions used to build the pipeline.
top_genes <- function(mat, n_top = 500){
  # use smallest between n_top and number of genes
  n_top <- min(n_top, nrow(mat))
  # order by decreasing gene variance and slice
  rv <- matrixStats::rowVars(as.matrix(mat))
  select_n <- order(rv, decreasing = TRUE)[seq_len(n_top)]
  mat <- mat[select_n, ]
  return(mat)
}

get_pc <- function(mx, md){
  pc <- PCAtools::pca(mx, metadata = md, center = TRUE, scale = TRUE, removeVar = 0.1)
  return(pc)
}

build_graph <- function(pc, npc = 25, k = 20){
  ## pc space
  pcm <- pc$rotated[, 1:npc]

  # find k-nearest neighbors
  knn_result <- RANN::nn2(pcm, k = k)
  knn_idx <- knn_result$nn.idx

  # store sparse matrix triplets (i, j, value)
  i_indices <- c()
  j_indices <- c()
  values <- c()

  npat <- nrow(pcm)
  # adj <- matrix(0, npat, npat)

  for (i in 1:npat){
    for (j in knn_idx[i, ]){
      if (i != j){ ## avoid self-loop
        neighbors_i <- knn_idx[i,]
        neighbors_j <- knn_idx[j,]
        jaccard_sim <- length(intersect(neighbors_i, neighbors_j)) /
                       length(union(neighbors_i, neighbors_j)) ## union takes unique values

        # Store indices and values for sparse matrix
        i_indices <- c(i_indices, i)
        j_indices <- c(j_indices, j)
        values <- c(values, jaccard_sim)

        # dense matrix
        # adjt[i, j] <- jaccard_sim
      }
    }
  }

  # Create sparse matrix using triplet format
  adj <- sparseMatrix(i = i_indices, j = j_indices, x = values, dims = c(npat, npat))

  # build graph
  g <- graph_from_adjacency_matrix(adj,
    mode = "max", ## preserve the strongest connections, same of adj <- pmax(adj, t(adj))
    weighted = TRUE
  )
  return(g)
}

find_clusters <- function(g, mx, resolution = 1){
  # Louvain algorithm for community detection
  louvain_communities <- cluster_louvain(g, resolution = resolution)

  # cluster assignment
  clusters <- membership(louvain_communities)

  return(clusters)
}

## umap wrapper
umap <- function(mx, ...){
  defaults <- list(
    n_components = 2,
    n_neighbors = 20,     ## as perplexity in t-SNE
    min_dist = 0.1,       ## how tightly points cluster together
    metric = "euclidean",
    spread = 1,           ## global structure preservation
    n_threads = 10
  )
  user_args <- modifyList(defaults, list(...))
  purrr::exec(uwot::umap, X = t(mx), !!!user_args)
}

## tsne wrapper
tsne <- function(mx, ...){
  defaults <- list(
    dims = 2,
    perplexity = 20,
    num_threads = 10
  )
  user_args <- modifyList(defaults, list(...))
  purrr::exec(Rtsne::Rtsne, X = t(mx), !!!user_args)
}

join_results <- function(tib, pc, clusters){
  if(is.list(tib)){ ## tsne returns a list ..
    restib <- tibble(
      sample = rownames(pc$rotated),
      cluster = as.factor(clusters),
      tsne1 = tib$Y[, 1],
      tsne2 = tib$Y[, 2]) |>
      left_join(meta, by = c('sample' = 'sampleID'))
  }else{ ## .. umap a dataframe
    restib <- tibble(
      sample = rownames(pc$rotated),
      cluster = as.factor(clusters),
      umap1 = tib[, 1],
      umap2 = tib[, 2]) |>
      left_join(meta, by = c('sample' = 'sampleID'))
  }
  return(restib)
}

plot_clusters <- function(tib, cluster = 'cluster', animate = FALSE){
  dim1 <- colnames(tib)[3]
  dim2 <- colnames(tib)[4]

  p <- ggplot(tib, aes(x = !!sym(dim1), y = !!sym(dim2), color = !!sym(cluster))) +
    geom_point(alpha = 0.7, size = 2) +
    labs(title = str_replace(cluster, '_', ' '), x = dim1, y = dim2) +
    theme_minimal()

  if(!animate & cluster == 'cluster'){
    # Calculate cluster centroids for label positioning
    cluster_centers <- tib |>
      group_by(!!sym(cluster)) |>
      summarise(
        x_center = mean(!!sym(dim1), na.rm = TRUE),
        y_center = mean(!!sym(dim2), na.rm = TRUE),
        .groups = 'drop'
      )

    p <- p +
      geom_text_repel(
        data = cluster_centers,
        aes(x = x_center, y = y_center, label = !!sym(cluster)),
        color = "black",
        size = 8,
        fontface = "bold",
        vjust = 0.5,
        hjust = 0.5
      )
  }
  return(p)
}

formatter <- function(tib, cols_to_format = "all", digits = 3){
  selector <- if(length(cols_to_format) == 1 && cols_to_format == "all"){
    where(is.numeric)
  } else {
    all_of(cols_to_format)
  }

  tib |>
    mutate(across({{ selector }},
           ~format(., scientific = TRUE, digits = digits)))
}

datatable <- function(tib, row2display = 10) {
  DT::datatable(tib,
    rownames   = FALSE,
    extensions = "Buttons",
    options    = list(
      dom = "Bfrtip",
      scrollX = TRUE,
      pageLength = row2display,
      buttons = list(
        list(
          extend  = "collection",
          buttons = c("csv", "excel"),
          text    = "Download"
        )
      )
    ),
    class = "display",
    style = "bootstrap"
  )
}
A. Clustering all patients
mxtop <- top_genes(mx, n_top = 3000)
pc <- get_pc(mxtop, md)
g <- build_graph(pc, npc = 25, k = 20)
cls <- find_clusters(g, mxtop, resolution = 1)
t-SNE
tsneres <- tsne(mxtop, perplexity = 20)
tsnetib <- join_results(tsneres, pc, cls)

vars <- c('cluster', 'pam50_subtype')
plist <- map(vars, ~plot_clusters(tsnetib, .x))
wrap_plots(plist, ncol = 2)
UMAP
umapres <- umap(mxtop, n_neighbors = 20, spread = 1)
umaptib <- join_results(umapres, pc, cls)

vars <- c('cluster', 'pam50_subtype')
plist <- map(vars, ~plot_clusters(umaptib, .x))
wrap_plots(plist, ncol = 2)
Patient cluster assignment
The table below shows the obtained cluster assignment for each patient.
tsnetib |>
  left_join(umaptib, by = 'sample', suffix=c('_tsne', '_umap')) |>
  select(sample, sampleName_tsne, cluster_tsne,
    tsne1, tsne2, umap1, umap2,
    tumor_size_tsne, lymph_node_group_tsne,
    lymph_node_status_tsne, er_status_tsne,
    pgr_status_tsne, her2_status_tsne,
    ki67_status_tsne, nhg_tsne, pam50_subtype_tsne,
    overall_survival_days_tsne, overall_survival_event_tsne,
    endocrine_treated_tsne, chemo_treated_tsne) |>
  rename_with(~ str_remove(.x, "_tsne$")) |>
  formatter(cols_to_format = c("tsne1", "tsne2", "umap1", "umap2")) |>
  datatable()
B. Clustering of patients with complete annotations for all 5 biomarkers
## reduce dataset to complete cases
md_complete <- meta |>
  filter(!is.na(er_status)   & !is.na(pgr_status) &
         !is.na(her2_status) & !is.na(ki67_status) &
         !is.na(nhg)) |>
  column_to_rownames(var = 'sampleID')

mx_complete <- gexp |>
    select(genes, rownames(md_complete)) |>
    column_to_rownames(var = 'genes')
## run pipeline
mxtop_complete <- top_genes(mx_complete, n_top = 3000)
pc_complete <- get_pc(mxtop_complete, md_complete)
g_complete <- build_graph(pc_complete, npc = 25, k = 20)
cls_complete <- find_clusters(g_complete, mxtop_complete, resolution = 1)t-SNE
vars <- c('cluster', 'er_status', 'pgr_status', 'her2_status', 'ki67_status', 'nhg')

## tsne
tsneres_complete <- tsne(mxtop_complete, perplexity = 20)
tsnetib_complete <- join_results(tsneres_complete, pc_complete, cls_complete)

plist <- map(vars, ~plot_clusters(tsnetib_complete, .x))
wrap_plots(plist, ncol = 2)
UMAP
umapres_complete <- umap(mxtop_complete, n_neighbors = 20, spread = 1)
umaptib_complete <- join_results(umapres_complete, pc_complete, cls_complete)

plist <- map(vars, ~plot_clusters(umaptib_complete, .x))
wrap_plots(plist, ncol = 2)
C. Clustering of patients separately for each biomarker
biomarkers <- c('er_status', 'pgr_status', 'her2_status', 'ki67_status', 'nhg')

tsnetib_bm <- list()
umaptib_bm <- list()

ptsne <- list()
pumap <- list()

for(biomarker in biomarkers){
  ## remove not annotated patients
  md_bm <- meta |>
    filter(!is.na(!!sym(biomarker))) |>
    column_to_rownames(var = 'sampleID')

  mx_bm <- gexp |>
    select(genes, rownames(md_bm)) |>
    column_to_rownames(var = 'genes')

  ## clustering
  mxtop_bm <- top_genes(mx_bm, n_top = 3000)
  pc_bm <- get_pc(mxtop_bm, md_bm)
  g_bm <- build_graph(pc_bm, npc = 25, k = 20)
  cls_bm <- find_clusters(g_bm, mxtop_bm, resolution = 1)

  ## save results
  tsneres_bm <- tsne(mxtop_bm, perplexity = 20)
  tsnetib_bm[[biomarker]] <- join_results(tsneres_bm, pc_bm, cls_bm)

  umapres_bm <- umap(mxtop_bm,  n_neighbors = 20)
  umaptib_bm[[biomarker]] <- join_results(umapres_bm, pc_bm, cls_bm)

  vars <- c('cluster', biomarker)
  ptsne[[biomarker]] <- map(vars, ~plot_clusters(tsnetib_bm[[biomarker]], .x))
  pumap[[biomarker]] <- map(vars, ~plot_clusters(umaptib_bm[[biomarker]], .x))
}
t-SNE
pwrap <- map(ptsne, ~.x[[1]] + .x[[2]])
wrap_plots(pwrap, ncol = 1)
UMAP
pwrap <- map(pumap, ~.x[[1]] + .x[[2]])
wrap_plots(pwrap, ncol = 1)
Clustering at different resolutions
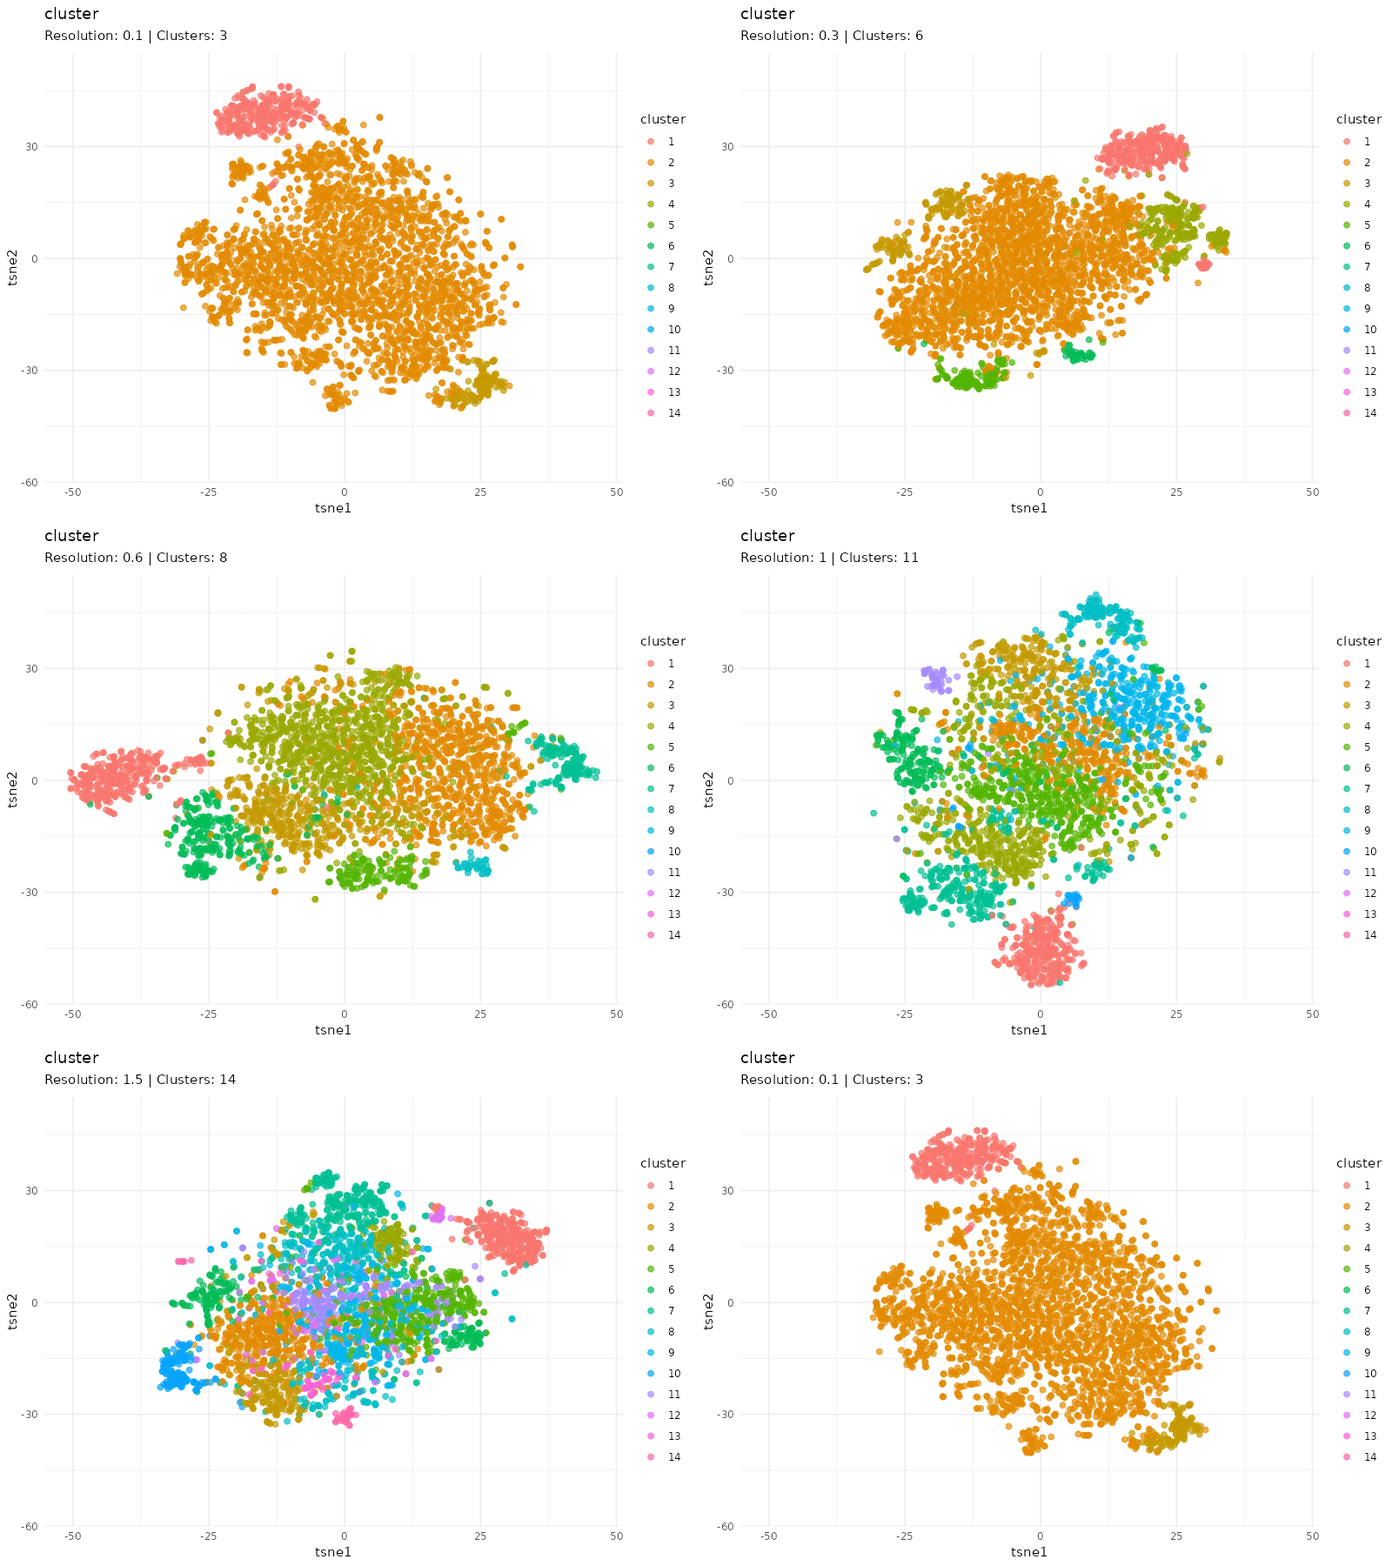
Clusters detected at each resolutions are marked in different colors. Patients in the community colored in red tend to cluster together at different resolutions, suggesting that patients within this community are strongly connected (similar expression profiles).
# loop for resolutions
resolutions <- c(0.1, 0.3, 0.6, 1, 1.5)

tsne_tune <- map_dfr(resolutions, function(resolution){
  cls <- find_clusters(g, mxtop, resolution = resolution)
  tsne <- tsne(mxtop, dims = 2, perplexity = 20)
  tibble(
    sample = colnames(mxtop),
    cluster = as.factor(cls),
    tsne1 = tsne$Y[, 1],
    tsne2 = tsne$Y[, 2],
    resolution = resolution,
    ncl = length(unique(cls)) ## number of clusters at a given resolution
  ) |>
  left_join(meta, by = c('sample' = 'sampleID'))
})

# {unique(tsne_tune$ncl[tsne_tune$resolution == closest_state])}
ncl_lookup <- tsne_tune |> distinct(resolution, ncl) |> deframe()

plot <- plot_clusters(tsne_tune, cluster = 'cluster', animate = TRUE) +
  # theme(legend.position="none") +
  labs(subtitle = "Resolution: {closest_state} | Clusters: {ncl_lookup[as.character(closest_state)]}") +
  transition_states(resolution, transition_length = 5, state_length = 3) +
  ease_aes("linear")

animate(
  plot,
  width = 8,
  height = 6,
  res = 100,
  nframes = 300,
  fps = 30,
  device = "ragg_png",
  renderer = gifski_renderer()
)
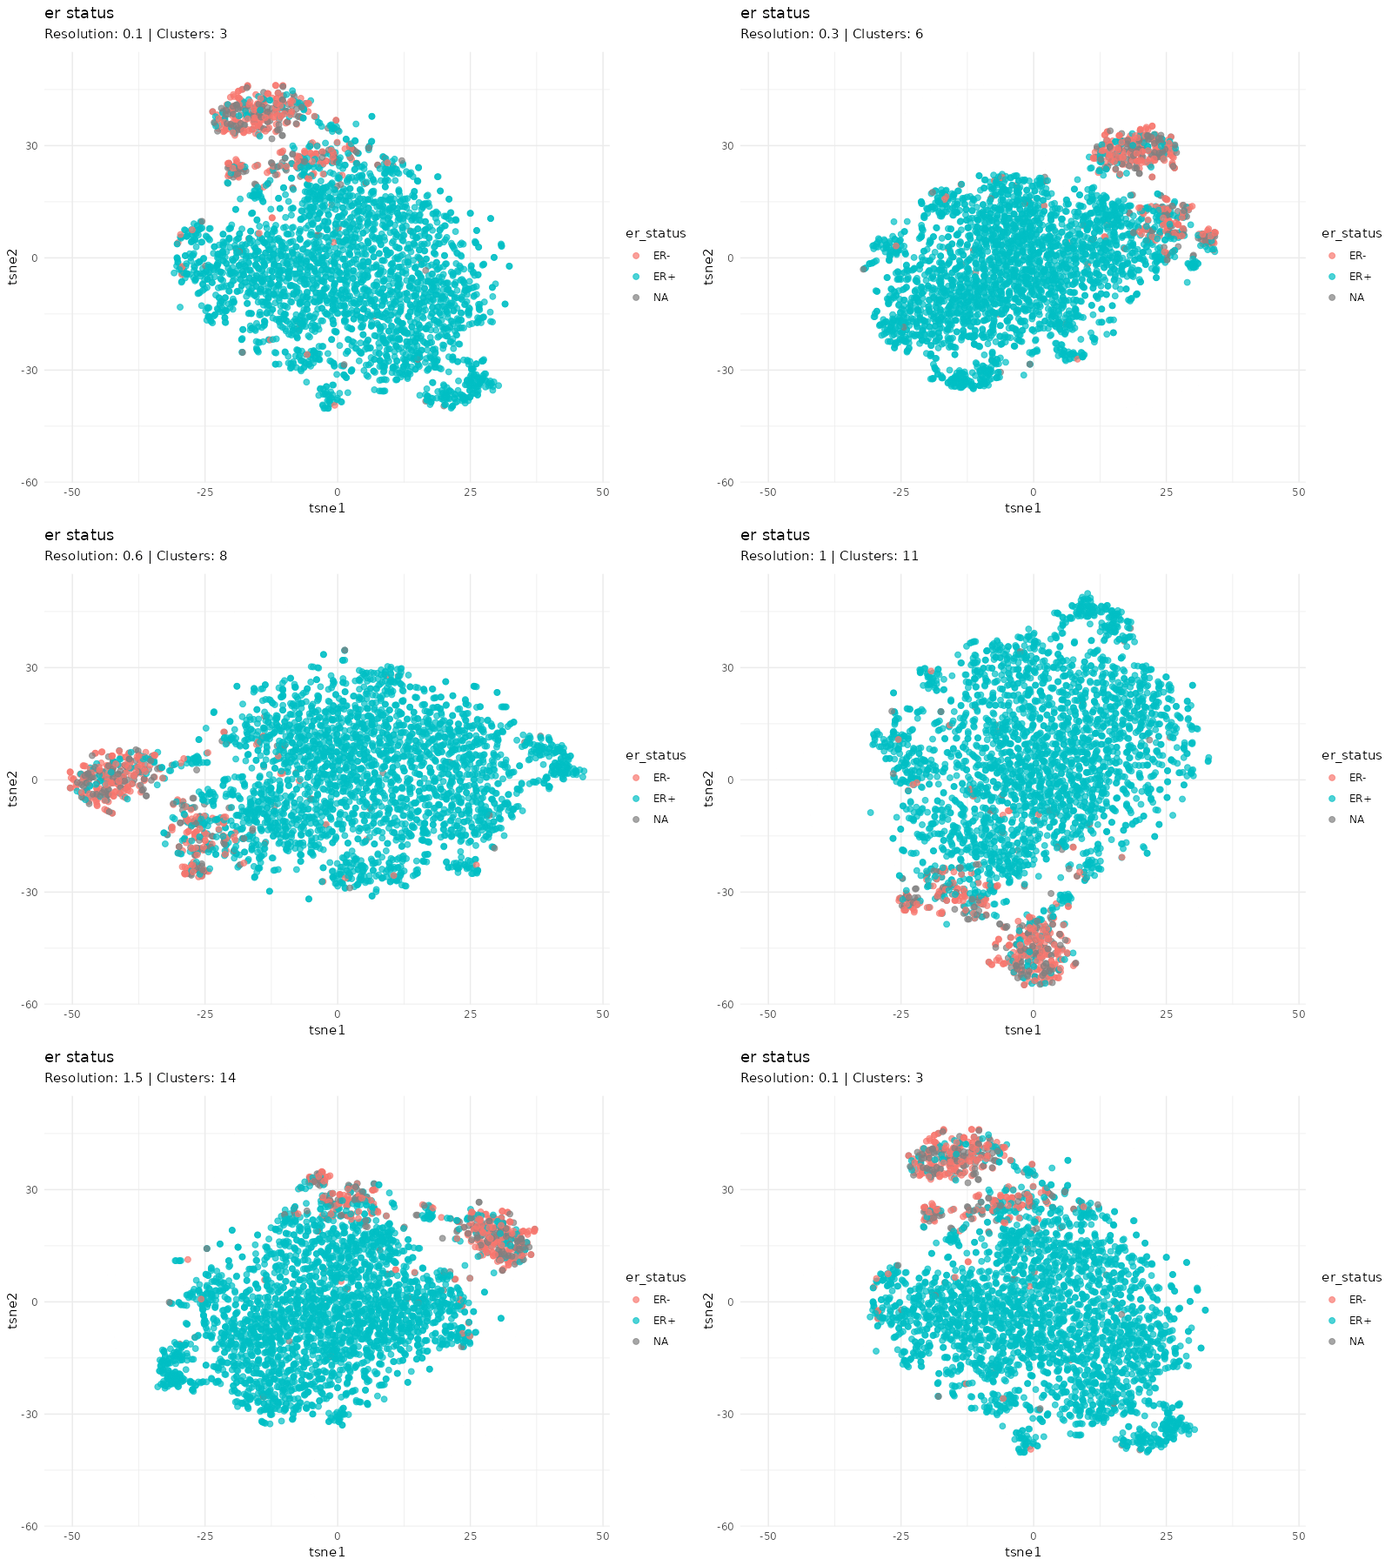
When specifically coloring patients based on ER status, we observe that the expression profiles of ER- patients cluster well. Furthermore, it is worth noting that the status of some patients within this cluster is unknown (gray patients). These might be considered as ER- patients since they cluster strongly with patients annotated as ER-.
plot <- plot_clusters(tsne_tune, cluster = 'er_status', animate = TRUE) +
  labs(subtitle = "Resolution: {closest_state} | Clusters: {ncl_lookup[as.character(closest_state)]}") +
  transition_states(resolution, transition_length = 5, state_length = 3) +
  ease_aes("linear")

animate(
  plot,
  width = 8,
  height = 6,
  res = 100,
  nframes = 300,
  fps = 30,
  device = "ragg_png",
  renderer = gifski_renderer()
)
Conclusions
I identified breast cancer subtypes based on gene expression data via a graph-based approach. Two main distinct clusters of patients are detected. The smaller cluster is enriched for ER- patients and likely represent the most aggressive expression profile (basal PAM50 subtype, e.g. G3, PgR-, ER-, HER-).
Next step
Cluster assignment can be used as features in a supervised learning approach to predict biomarker status (such as random forest, support vector machine, label propagation). Furthermore, we can use LLMs to further validate biological insights using AI-powered tools tailored for bioinformatics resources such as ExpasyGPT.